Mapping options
Crop
Maps can be cropped to remove some useless part of the map (e.g. bakelite around the specimen, oxidized or contaminated surface…) or to avoid some artifact of measurements (e.g. surface effects, roughness or slope on the surface…). This option is really useful, especially to clean dataset for further statistical analysis. After cropping, it is possible to create a new .xls file (with cropped dataset), by pressing the ‘XLS’ button at the bottom of the GUI.
Colormap
It is possible to set different colormap for the mapping into the GUI. The default ‘Jet’ colormap from Matlab [1] is not divergent and obscures real patterns. Thus, it is sometimes difficult to distinguish the default line color styles. Many authors proposed to use divergent colormaps instead of default Matlab colormaps [2], [3], [4].
The Matlab function used to generate a divergent colormap is: diverging_map.m
The colormap can be flipped for aesthetic reason.
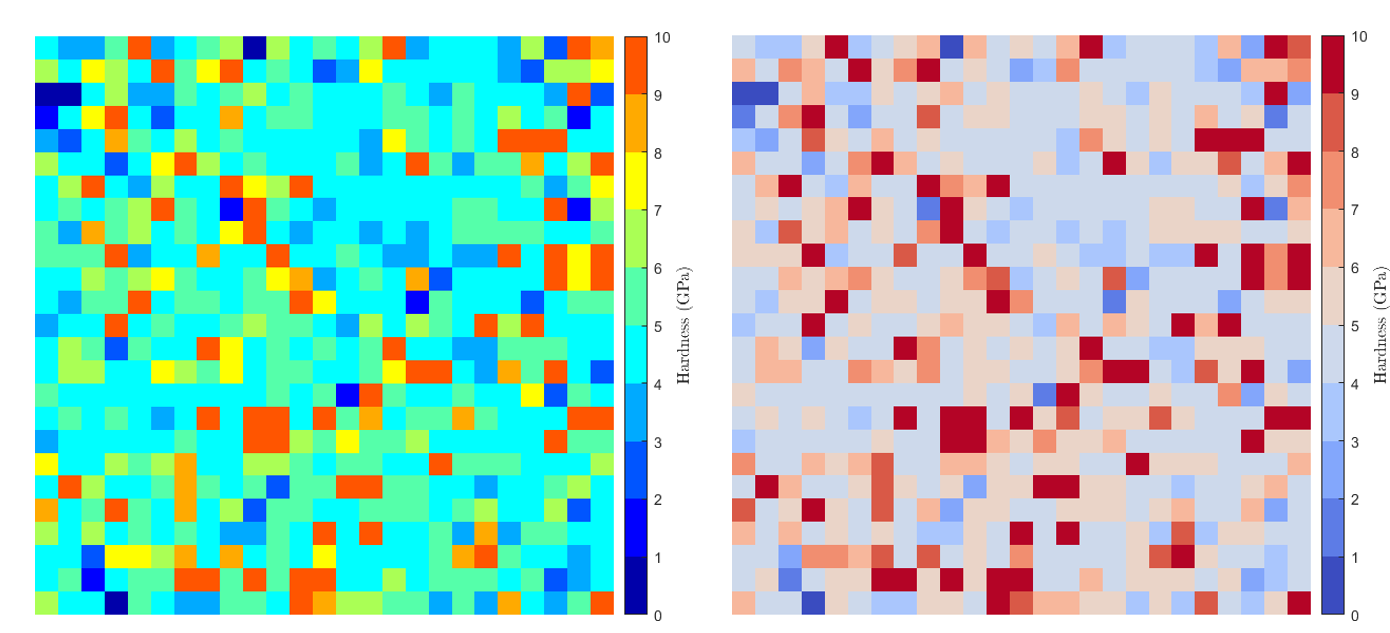
Figure 17 Maps with non divergent colormap (on the left) and with divergent colormap (on the right)
Colorbar
The limits (minimum and maximum) and the number of steps of the colorbar can be defined automatically or can be set by hand. A logarithmic colorbar can be applied to emphasize gradient on a map when there is a large difference in term of mechanical property values between 2 phases.
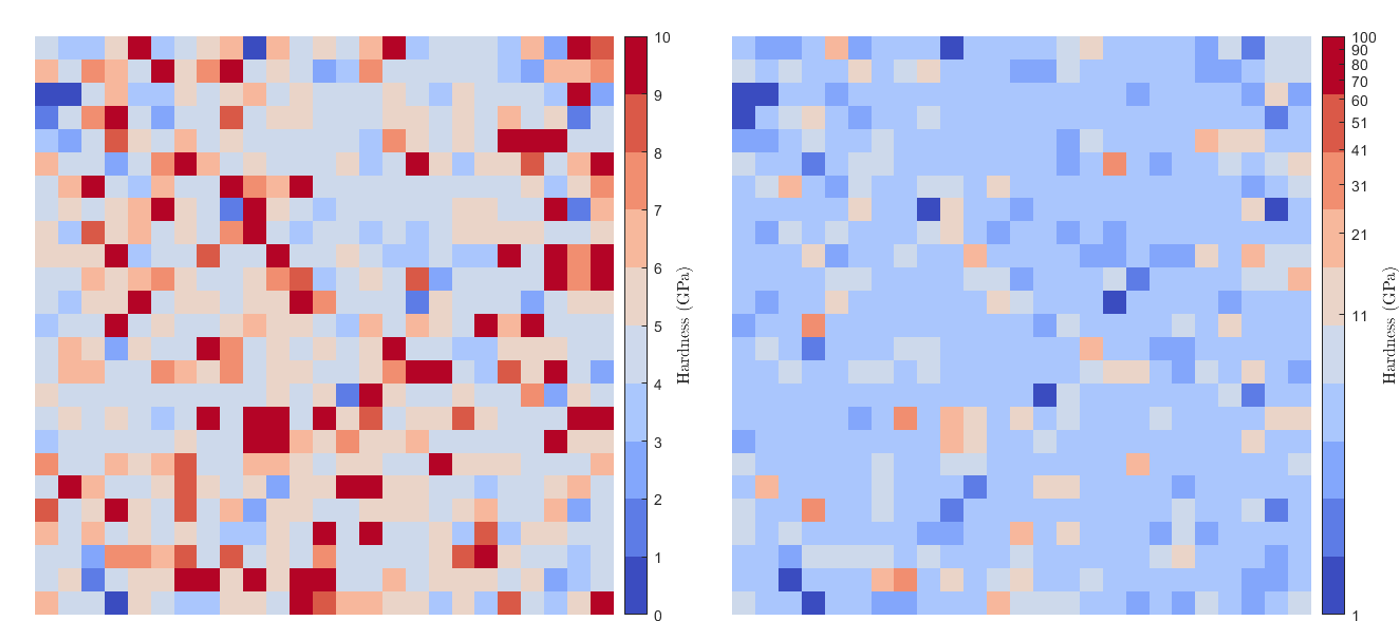
Figure 18 Maps without (on the left) and with (on the right) a logarithmic colorbar
Markers / Grid
Simple grid (corresponding to a regular pattern) or markers grid showing indent positions can be plotted on an indentation map, in order to help for the overlay of the mechanical map onto the microstructural map.

Figure 19 Maps with markers for indent positionning (on the right)